
History of Social Media
The roots of social media can be traced back to the 1970s when the first internet chat rooms emerged. 💬
By the 1990s, the first recognisable social media sites began popping up.
In 1996, the whole social media journey began with the first website called Bolt.
Soon after came Six Degrees, where people created profiles and added friends, just like we do today.
In 1999, LiveJournal popped up, allowing people to start their blogs.
The beginning of the 21st century saw the emergence of household names like Facebook, Twitter, and Instagram, changing our communication landscape forever.
How many people use social media?
Have you ever wondered how many people are on social media? 👥
In 2022, 4.59 billion people worldwide are actively engaging with each other on various social media platforms.¹
And the average person doesn't stick to just one platform. They switch between 6.6 different social media sites every month.²
But if you look at the number of people using social media, you'll see that it has increased significantly.
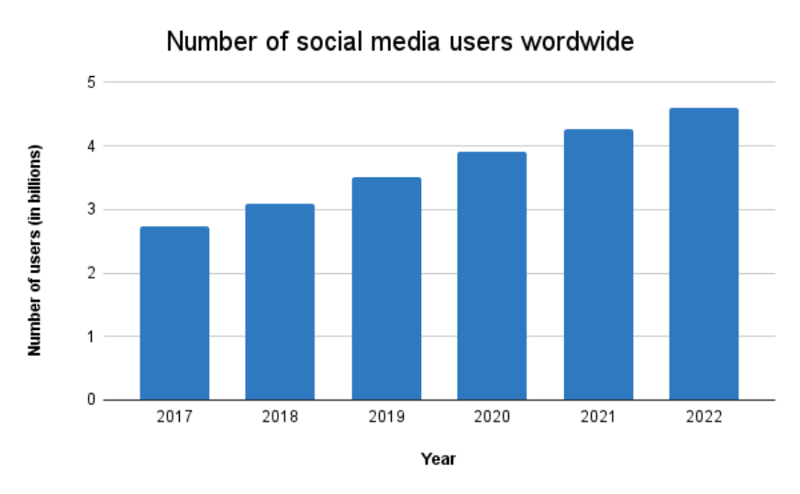
Here's a detailed look at the user growth count from 2017 to 2022.
|
Year |
Number of users |
|
2017 |
2.73 |
|
2018 |
3.1 |
|
2019 |
3.51 |
|
2020 |
3.9 |
|
2021 |
4.26 |
|
2022 |
4.59 |
In the UK, around 57.10 million people used social media in January 2023.³
Simply put, almost 9 in 10 internet users in the UK use some form of social media.
Looking back, in most countries, especially in the UK, more people join social media every year. 🇬🇧
Percentage of people using social media
Presently, 56.6% of the world's population uses various social media platforms.¹
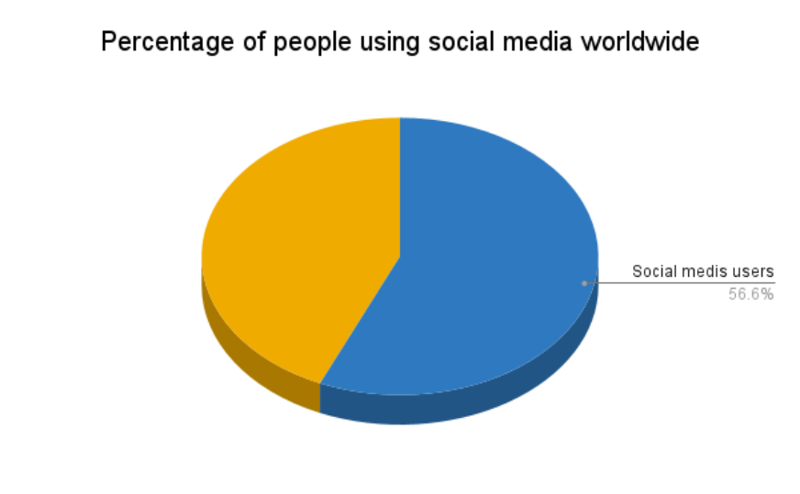
In the UK, the picture is even more pronounced.
In January 2023, around 84.3% of Brits were actively engaging on social media.³
Social media usage by gender and age
Wondering who uses social media networks all over the world?
Let's look at the age and gender distribution of these users. 👀
Gender of global social media users
Looking at social media users worldwide, the distribution between men and women is almost even.
Men are slightly ahead, with 54% of global users.⁴ 🧔🏼♂️
Women, however, aren't far behind and have a 46% share of the worldwide social media presence.⁴
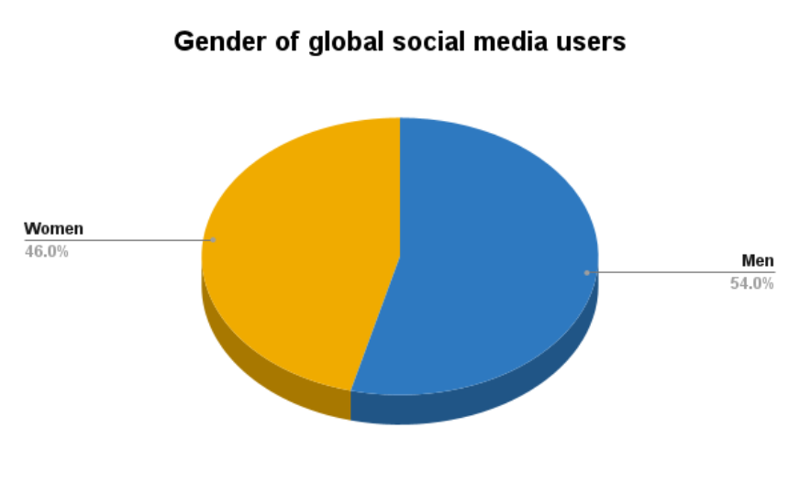
The data clearly shows that both the genders are closely connected to the digital world.
Age of global social media users
Have you ever wondered about the ages of people who scroll, like, and post globally?
It turns out that social media isn't just for young people! 👧🏼
Different platforms attract different age groups, each with its own trends and styles.
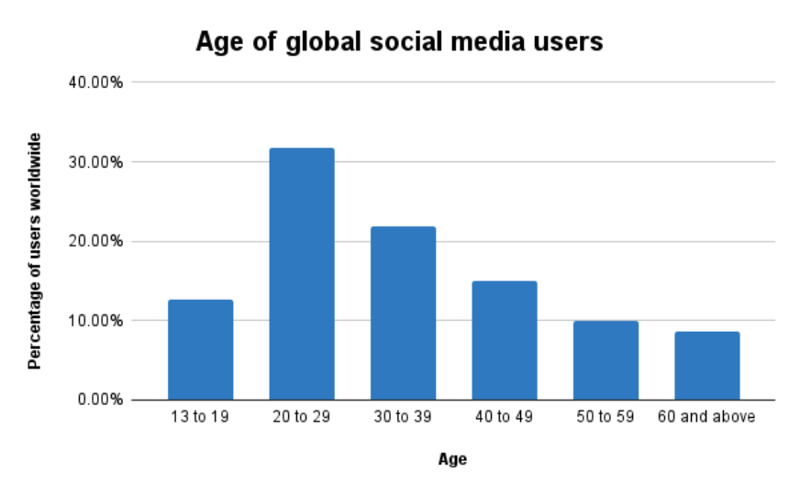
Here is a breakdown of the age distribution of social media users globally:
|
Age |
Percentage of users worldwide |
|
13 to 19 |
12.7% |
|
20 to 29 |
31.8% |
|
30 to 39 |
21.9% |
|
40 to 49 |
15% |
|
50 to 59 |
10% |
|
60 and above |
8.6% |
So, most social media users around the world are aged between 20 and 39.⁵
Gender of social media users in the UK
People of all genders like to use social media.
In the UK, a slightly higher number of men use social platforms compared to women, but the difference is minimal.
51.6% of social media users are men, and 48.4% are women.⁶ 👩🏻🦰
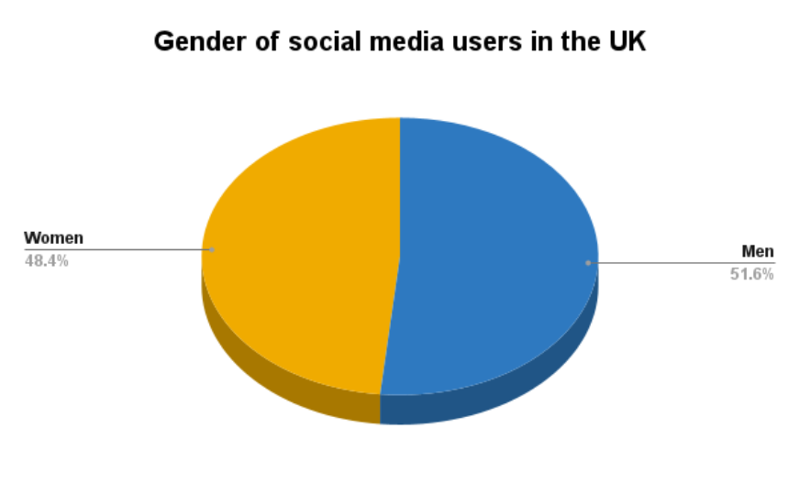
Globally, this near-equal gender distribution is quite common.
Age of social media users in the UK
A look at the age groups of social media users in the UK reveals interesting patterns.
The younger generations have grown up in the digital age and are, therefore, more likely to use social media frequently.
But it's not just the young people who log on.
The appeal of social media has reached all age groups. 🧓🏻
From teenagers sharing their daily lives to seniors catching up with old friends, the platforms offer something for everyone.
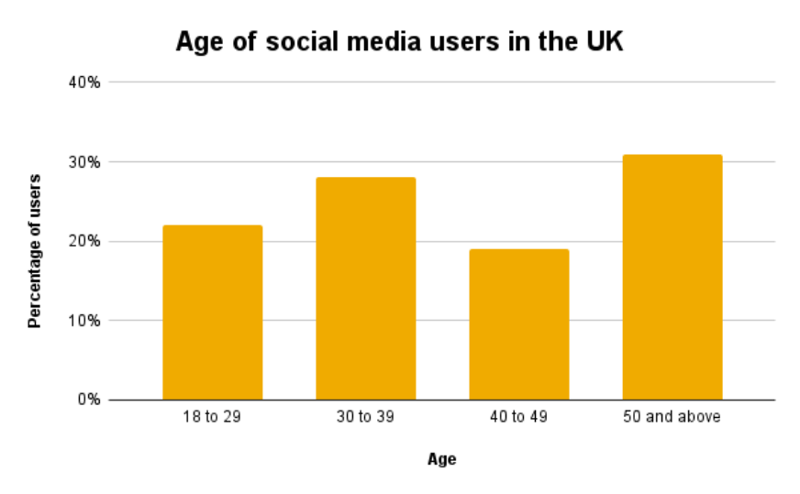
Let's take a look at these numbers in a little more detail:
|
Age |
Percentage of users |
|
18 to 29 |
22% |
|
30 to 39 |
28% |
|
40 to 49 |
19% |
|
50 and above |
31% |
People between 25 and 34 use social media the most.⁷
Those aged 45 to 54 use it the least.
Everyone older than 55 was grouped, making the data a bit complicated. 😕
Nevertheless, it's clear that younger adults use social media often, and usage decreases with age.
How many social media profiles does the average person have?
As we delve into the digital world, it's clear that we're juggling more online profiles than ever before.
In 2018, the Global Web Index found that if you're a Millennial or Generation Z, you probably have 9.8 accounts.⁸
That's a big jump from 2014 when most people had about 4.8 accounts. So we've almost doubled in four years.
So why the surge? 🤨
Well, there are more types of social media sites now, so people are joining more of them.
While there’s no recent study on this growth, data from 2013 to 2018 gives us a snapshot of this ever-evolving trend.⁹
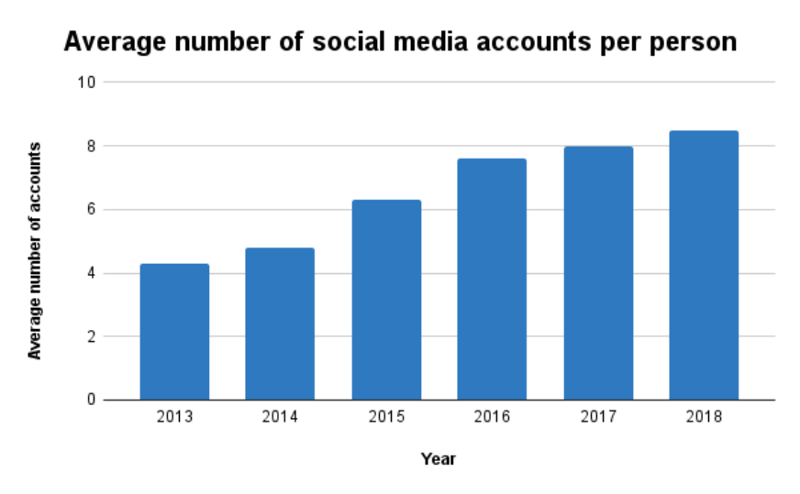
Let's look at these numbers a little more closely.
|
Year |
Average number of accounts per person |
|
2013 |
4.3 |
|
2014 |
4.8 |
|
2015 |
6.3 |
|
2016 |
7.6 |
|
2017 |
8 |
|
2018 |
8.5 |
However, this average varies from country to country.
Let's look at the top 5 countries and their average number of social media accounts.⁴
|
Country |
Average number of accounts per person |
|
India |
11.4 |
|
USA |
7.1 |
|
UK |
6.9 |
|
Canada |
6.8 |
|
Japan |
3.8 |
These social media statistics show that over 85% of people in the UK use social media but have fewer accounts than the global average. 🌏
The data suggests that Brits prefer using well-known social media platforms over experimenting with newer ones.
How many people use social networks for business?
Nowadays, many people use platforms like LinkedIn for business contacts or Instagram to show off products.
From small local shops reaching out to their community to individuals showing their professional skills, many use social media for business. 🛍️
Globally, 40% of all internet users use social media for work-related activities.¹⁰
In the UK, however, things are a little different. Only 27% of Brits use social media platforms for their work.¹⁰
This is less than in Indonesia, where 65% use social media for their work.¹⁰
On the other hand, Israel is at the bottom of the scale, with only 13%.¹⁰
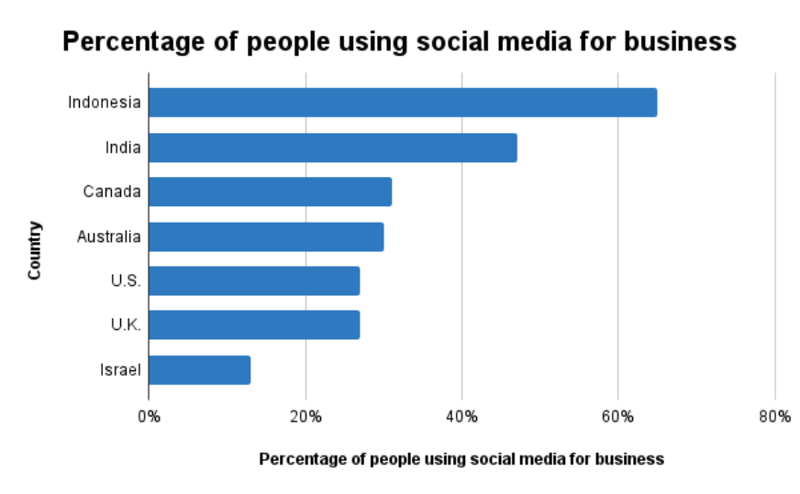
Let's take a closer look at these figures:
|
Country |
Percentage of people using social media for business |
|
Indonesia |
65% |
|
India |
47% |
|
Canada |
31% |
|
Australia |
30% |
|
U.S. |
27% |
|
U.K. |
27% |
|
Israel |
13% |
Growth of social media users over the years
Social media has grown considerably over time. 📈
Whereas years ago, only a few people used them, today, billions do so every day.
In 2018, only 42% of people around the world used social media.¹¹
But in just 4 years, this number has increased by 18%.
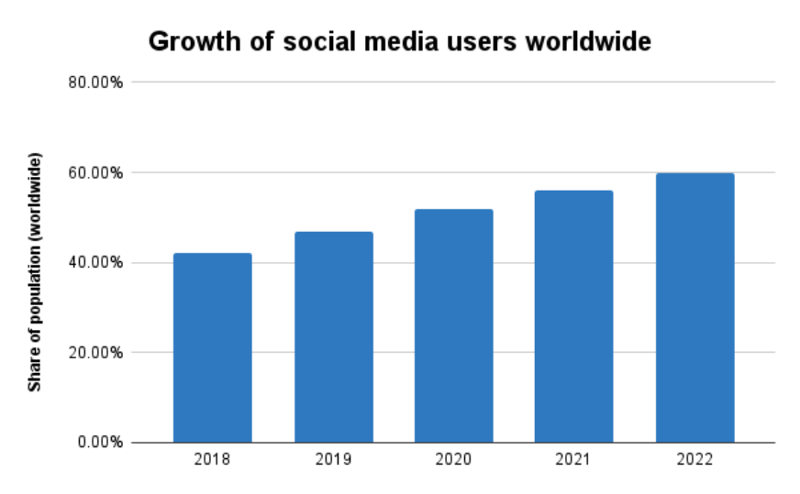
Here you can find a detailed insight into these numbers:
|
Year |
Share of population (worldwide) |
|
2018 |
42% |
|
2019 |
47% |
|
2020 |
52% |
|
2021 |
56% |
|
2022 |
60% |
Growth of social media users by country
Different countries use social media differently.
While the number of users in some countries snowballed, it took a little longer in others.
Many factors can influence this, such as how easy it's to access the internet or what is popular in the culture.
Between 2019 and 2020, India experienced the largest increase in social media users, adding 130 million new accounts.¹⁰
This is almost 10% of all Indians. 🇮🇳
Let's look at how many new users were added in different countries between 2019 and 2020.
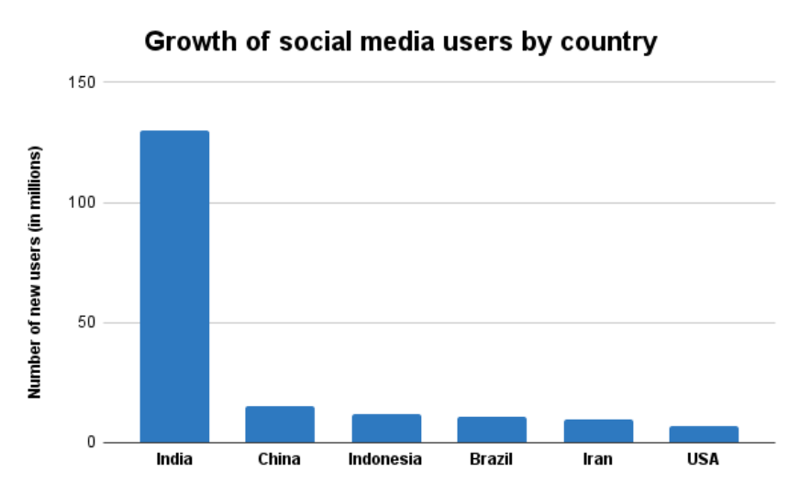
Here’s a detailed look into these numbers:
|
Country |
Number of new users added in 2019-2020 (in millions) |
|
India |
130 |
|
China |
15 |
|
Indonesia |
12 |
|
Brazil |
11 |
|
Iran |
9.4 |
|
USA |
6.9 |
Growth of social media users in the UK
Social media use in the UK is growing fast.
Brits are increasingly using it to chat, share, and get news.
From 2021 to 2022, social media use in the UK has increased significantly in just one year. 🗓️
From 88.5% in 2021, it climbed to a whopping 90% by 2022.¹²
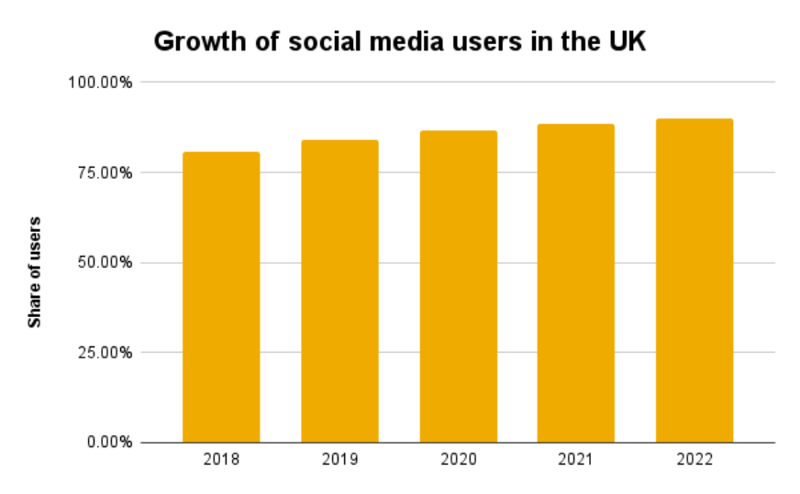
Now let's dive deeper and examine the year-on-year growth of social media in the UK.
|
Year |
Share of users in the UK |
|
2018 |
80.71% |
|
2019 |
83.95% |
|
2020 |
86.51% |
|
2021 |
88.5% |
|
2022 |
90.02% |
Social media penetration over the years
Social media penetration shows how many people use social media compared to the total population.
On average, 49% of all people worldwide use social media.¹⁰
But if we only look at people aged 13 and over, the share rises to 63%.¹⁰
UAE leads the list when it comes to social media penetration. 🇦🇪
In 2020, nearly 99% of the total population in the UAE were active on social media.¹⁰
Let's look at how other countries compare.
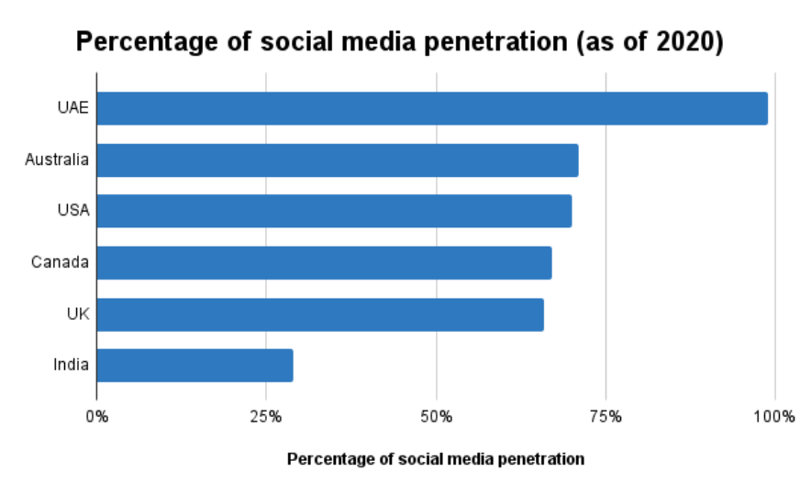
Let's take a closer look at this data:
|
Country |
Percentage of social media penetration as of 2020 |
|
UAE |
99% |
|
Australia |
71% |
|
USA |
70% |
|
Canada |
67% |
|
UK |
66% |
|
India |
29% |
Which country has the most active social media users in the world?
Identifying the country with the most active social media users can reveal insights into global digital behaviour.
With its vast population, China tops the list and has the most social media users.
In 2022, around 1,021.96 million users were active on social media in China.¹³ 👨👩👧👦
India is close behind with around 755.47 million users.¹³
The United Kingdom ranks 12th, with around 61.67 million users.¹³
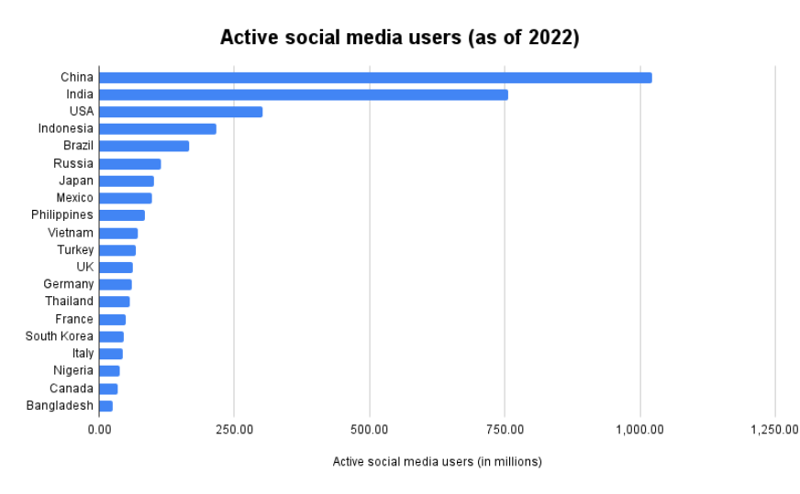
Let's take a closer look at these figures:
|
Country |
Active social media users as of 2022 |
|
China |
1,021.96 |
|
India |
755.47 |
|
USA |
302.25 |
|
Indonesia |
217.3 |
|
Brazil |
165.45 |
|
Russia |
115.05 |
|
Japan |
101.98 |
|
Mexico |
98.21 |
|
Philippines |
84.07 |
|
Vietnam |
72.29 |
|
Turkey |
67.11 |
|
UK |
61.67 |
|
Germany |
60.88 |
|
Thailand |
56.27 |
|
France |
48.71 |
|
South Korea |
46.09 |
|
Italy |
43.18 |
|
Nigeria |
38.47 |
|
Canada |
34.47 |
|
Bangladesh |
24.49 |
Average time spent on social media
All over the world, people aren't just checking their social media for a moment.
Instead, they spend much of their day scrolling, posting, and engaging. ⏰
In 2020, people aged 16-64 spent an average of 2 hours and 25 minutes daily on social media, regardless of their device.¹⁴
In 2023, this daily average has increased by about 6 minutes.
The World Health Organisation estimates the average life expectancy worldwide is 73 years.¹⁵
If someone maintains this use rate, they'll spend about 5.7 years on these platforms. 📆
Today, people worldwide spend about 38% of their time on the internet using social media.
Here you can see how the average time a person spends on social media has increased over the years.
.png?vh=bca133&p=n&vh=bca133&width=800&height=10000&func=bound)
Let's take a closer look at these figures:
|
Year |
Average time spent per day |
|
2012 |
90 |
|
2013 |
95 |
|
2014 |
104 |
|
2015 |
111 |
|
2016 |
128 |
|
2017 |
134 |
|
2018 |
142 |
|
2019 |
145 |
|
2020 |
145 |
|
2021 |
145 |
|
2022 |
147 |
|
2023 |
151 |
Data shows that our daily hours on social media are increasing every year.
Since 2012, the average time users devote to social media has increased by 67.78%.
Average time spent on social media in the UK
People in the UK use social media a lot, but not as much as the global average.
On average, individuals in the UK spend about 2 hours a day on social media.¹⁶
This is 31 minutes less than the global average. ⏳
Which country's residents spend the most time on social media?
Have you ever wondered which nation spends the most hours scrolling, posting and engaging on social media?
While you might assume technologically advanced countries would lead, Nigeria surprisingly holds the top position. 🇳🇬
On average, Nigerians spend 4 hours and 36 minutes on social media daily.¹⁷
Brazil is behind Nigeria, spending one hour less on these platforms.
Let's see in which country people are most active on social media.
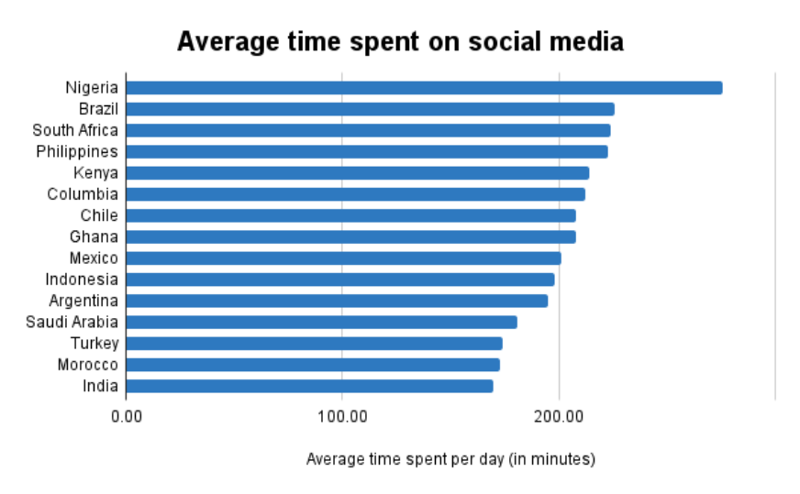
Here's a closer look at the numbers:
|
Country |
Average time spent per day |
|
Nigeria |
4 hours 36 minutes |
|
Brazil |
3 hours 46 minutes |
|
South Africa |
3 hours 44 minutes |
|
Philippines |
3 hours 43 minutes |
|
Kenya |
3 hours 34 minutes |
|
Columbia |
3 hours 32 minutes |
|
Chile |
3 hours 28 minutes |
|
Ghana |
3 hours 28 minutes |
|
Mexico |
3 hours 21 minutes |
|
Indonesia |
3 hours 18 minutes |
|
Argentina |
3 hours 15 minutes |
|
Saudi Arabia |
3 hours 1 minute |
|
Turkey |
2 hours 54 minutes |
|
Morocco |
2 hours 53 minutes |
|
India |
2 hours 50 minutes |
Social media usage by device
Social media platforms are accessed in different ways, depending mainly on the choice of device.
An astonishing 99% of the world's users, or 4.43 billion people, access their social networks via mobile devices such as tablets or phones.¹⁰ 📱
Of these, 2.97 billion, or about 78%, use only their mobile phones.¹⁰
In contrast, only a small proportion, about 1.32% or 50 million users, rely exclusively on their desktops for social media.¹⁰ 💻
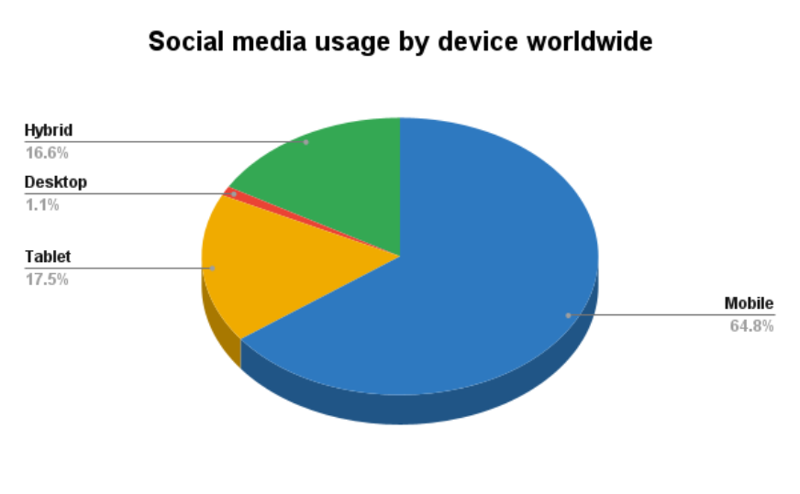
But there is also a group of 20% or 760 million users who alternate between desktop and mobile.¹⁰
|
Device |
Percentage of social media users |
|
Mobile |
78% |
|
Tablet |
21% |
|
Desktop |
1.32% |
|
Hybrid (Desktop and Mobile) |
20% |
Global trends in the UK are mirrored: around 98% of social media users access the platforms via mobile phones.
That is over 39 million people.
Most popular social media platforms
When immersed in social media platforms, it's hard to miss the giants dominating our screens and our time.
Facebook is at the top, the first to reach one billion users and now entertains over 2.9 billion people monthly.¹⁸
YouTube comes second with over 2.5 billion social media users.¹⁸
Currently, seven social media platforms have a user base of over one billion active members per month.
Of these, four are Meta-owned - WhatsApp, Facebook Messenger and Instagram. 🏬
In addition, as of July 2023, there are 15 social media platforms with at least 400 million active subscribers each.
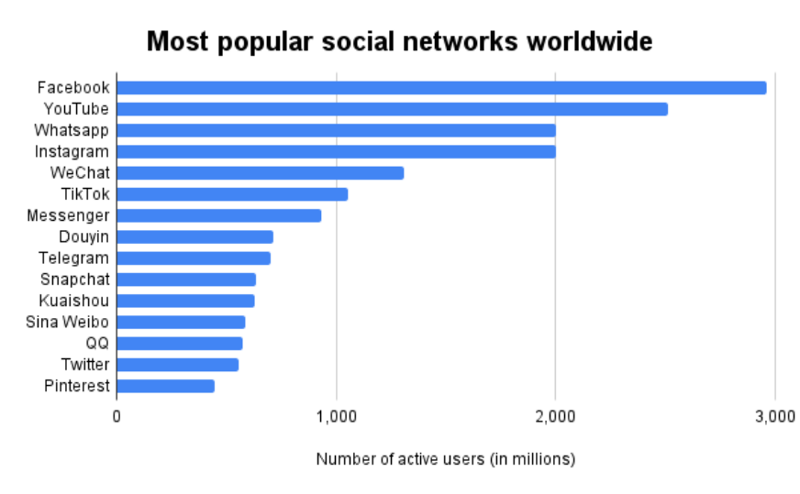
Let's take an in-depth look at these numbers:
|
Social media platforms |
Number of active users as of 2023 |
|
|
2,958 |
|
YouTube |
2,514 |
|
|
2,000 |
|
|
2,000 |
|
|
1,309 |
|
TikTok |
1,051 |
|
Facebook Messenger |
931 |
|
Douyin |
715 |
|
Telegram |
700 |
|
Snapchat |
635 |
|
Kuaishou |
626 |
|
Sina Weibo |
584 |
|
|
574 |
|
|
556 |
|
|
445 |
Social media is growing worldwide, and the number of users on each platform shows that. 📈
However, these numbers don't give us the full picture.
Many people use more than one social media platform each month.
So most users are counted on more than one platform.
Average daily time spent on leading social media platforms
Looking at the daily usage of the main social platforms, one might assume that Facebook, with its sheer number of users, would be the frontrunner.
But TikTok tops the list with an average of 95 minutes of daily use.¹⁹
YouTube is not far behind, taking up about 74 minutes of a user's day.¹⁹
Let's take a look at which social media apps are used the most on a daily basis.
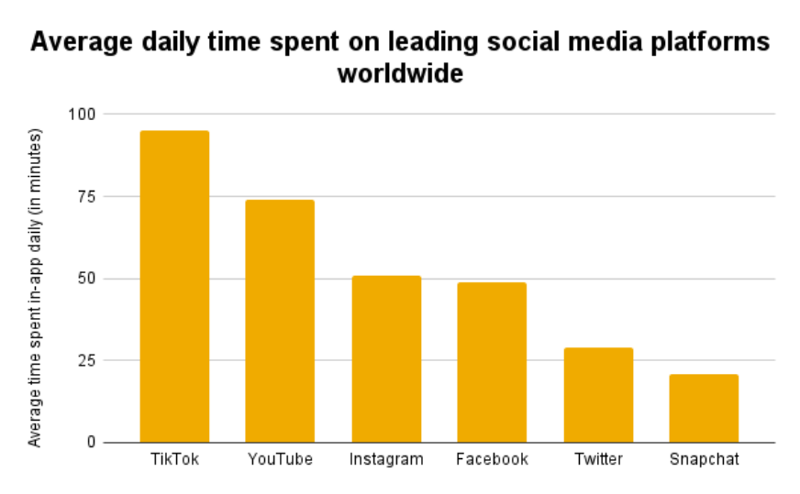
Here is a detailed breakdown of the numbers:
|
Social media platforms |
Average time spent in-app daily as of 2022 (in minutes) |
|
TikTok |
95 |
|
YouTube |
74 |
|
|
51 |
|
|
49 |
|
|
29 |
|
Snapchat |
21 |
Popular social media platforms in the UK
The UK's social media scene is slightly different from global trends.
Surprisingly, WhatsApp leads the way with 73.4% of internet users in the UK.²⁰ 💬
Facebook may be a global giant, but it follows closely behind in the UK, with 70.7% of users logging on regularly.²⁰
Let's explore the preferred social media platforms in the UK.
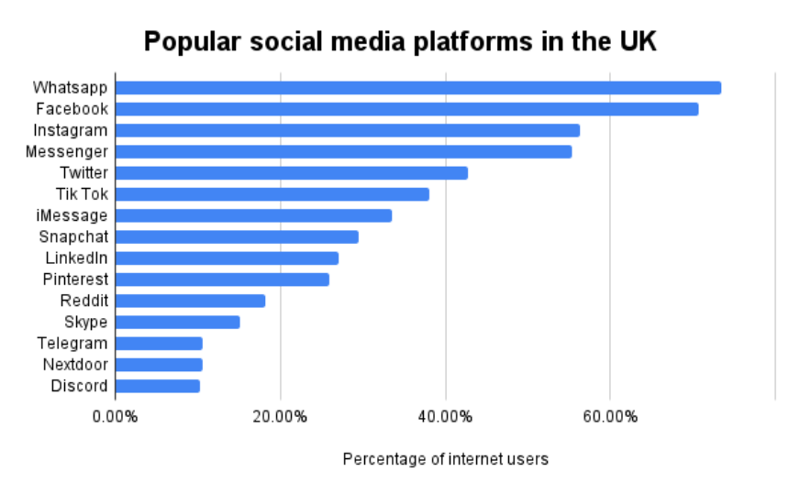
Here's a detailed look at those numbers:
|
Social media platforms |
Percentage of internet users as of 2022 |
|
|
73.4% |
|
|
70.7% |
|
|
56.4% |
|
Facebook Messenger |
55.3% |
|
|
42.8% |
|
Tik Tok |
38% |
|
iMessage |
33.5% |
|
Snapchat |
29.5% |
|
|
27.1% |
|
|
26% |
|
|
18.2% |
|
Skype |
15.1% |
|
Telegram |
10.6% |
|
Nextdoor |
10.5% |
|
Discord |
10.2% |
Average monthly time spent in the UK on leading social media platforms
People in the UK spend a bit less time online than people in other countries.
In 2022, people in the UK spent the most time on TikTok, about 27 hours a month for each person.²¹
YouTube was next, with people spending about 15 and a half hours on it every month.²¹ 📹
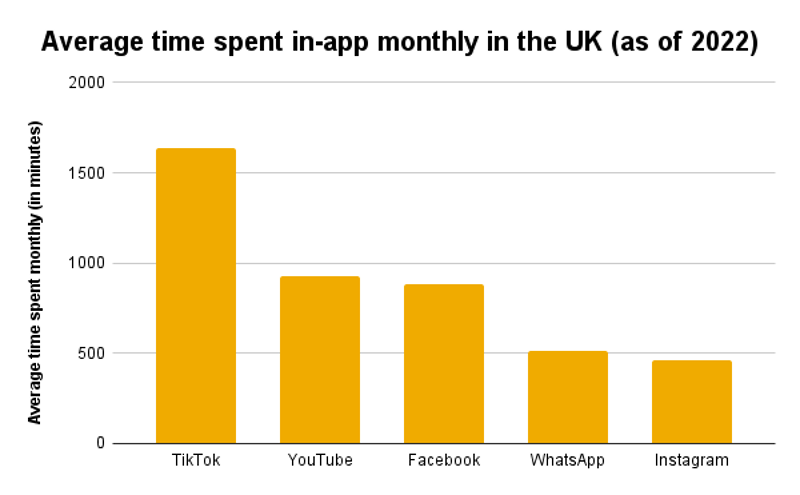
Here’s a detailed look at these numbers:
|
Social media platforms |
Average time spent in-app monthly in the UK as of 2022 (in hours and minutes) |
|
TikTok |
27 hours and 18 minutes |
|
YouTube |
15 hours and 30 minutes |
|
|
14 hours and 42 minutes |
|
|
8 hours and 36 minutes |
|
|
7 hours and 42 minutes |
-
![Social media channels]()
![Social media channels]()
![Smart Home Fox]() Smart Home FoxSocial mediaFor the latest updates on equipment tests, exclusive promotions, contests, and top deals, stay connected with us on our social media platforms. 👉Smart Home FoxSocial mediaFor the latest updates on equipment tests, exclusive promotions, contests, and top deals, stay connected with us on our social media platforms. 👉
Smart Home FoxSocial mediaFor the latest updates on equipment tests, exclusive promotions, contests, and top deals, stay connected with us on our social media platforms. 👉Smart Home FoxSocial mediaFor the latest updates on equipment tests, exclusive promotions, contests, and top deals, stay connected with us on our social media platforms. 👉![Smart Home Fox]()


Social media advertising statistics
Social media advertising often garners a mixed reputation among consumers.
However, from a corporate standpoint, these ads prove to be remarkably effective.
Companies must keep up-to-date with the latest trends and tailor their advertising strategies accordingly to maximise the efficacy of their social media campaigns. 🗓️
Back in 2017, the global market for social media advertising was valued at a significant 51.32 billion U.S. dollars.²²
Fast forward to 2023, and the industry has expanded by 426%, with the total expenditure skyrocketing to 269.68 billion U.S. dollars.²²
Let's explore global spending on social media advertising from 2017 to 2023.
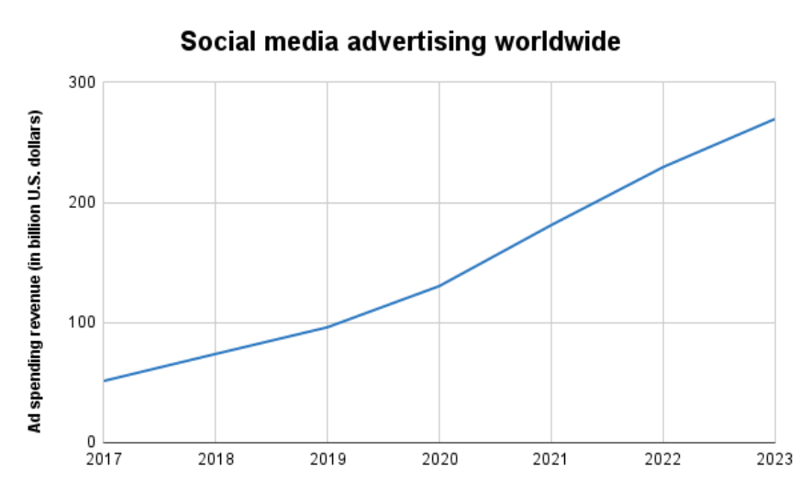
Let’s look into these numbers in a little more detail:
|
Years |
Ad spending revenue worldwide from 2017 to 2023 |
|
2017 |
51.32 |
|
2018 |
73.83 |
|
2019 |
96.07 |
|
2020 |
130.41 |
|
2021 |
181.19 |
|
2022 |
229.56 |
|
2023 |
269.68 |
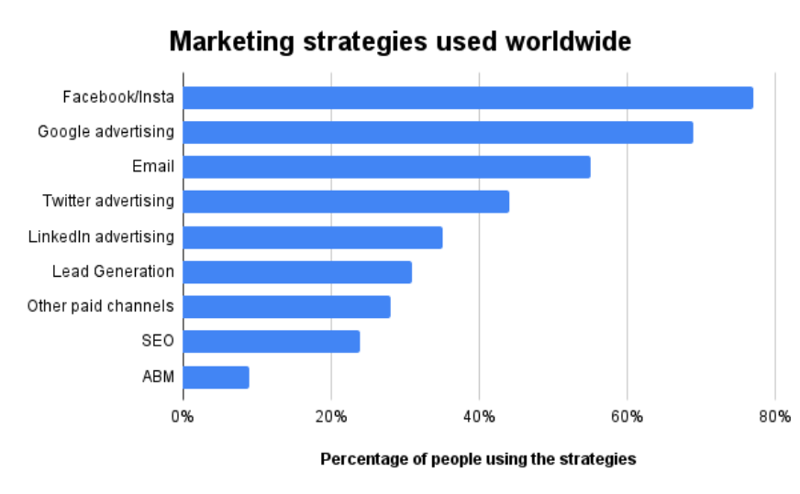
Social media platforms have also recently outpaced paid search as a preferred channel for advertising, with a 25% year-on-year growth.²³
But, which marketing method works the best? 🤔
According to 2021 data, retargeting as a marketing strategy works best for almost all product or service based industries.
Approximately 77% of both B2B and B2C marketers claim to incorporate retargeting into their advertising strategies on platforms like Facebook and Instagram.²⁴
Here's an overview of how retargeting compares in popularity to other marketing strategies.
Final thoughts on social media statistics - Our Conclusion
The digital tapestry of social media is constantly changing how we communicate worldwide. 🌎
It's fascinating to see the different habits, such as the record-breaking daily usage in Nigeria or the strong affinity of the British to WhatsApp.
Facebook may have the most users, but newer providers like TikTok are catching up fast regarding daily usage, with users clocking up an impressive 95 minutes per day.
Amidst these impressive numbers, however, it's essential to recognise that usage overlaps – many of us are active on multiple platforms.
These platforms undeniably impact our society, whether we use them for work, relaxation, or staying in touch with loved ones.
List of Sources
*1 - Statista
*2 - Forbes
*3 - Statista
*4 - DemandSage
*5 - Oberlo
*6 - Statista
*7 - Statista
*8 - Global Web Index
*9 - Statista
*10 - Backlinko
*11 - Statista
*12 - Statista
*13 - Statista
*14 - Statista
*15 - World Health Organization
*16 - Statista
*17 - Yahoo Finance
*18 - Statista
*19 - Statista
*20 - Statista
*21 - Statista
*22 - Statista
*23 - Zenith
*24 - MarketingChart
Table of Content
How many people use social media?
Social media usage by gender and age
How many social media profiles does the average person have?
How many people use social networks for business?
Growth of social media users over the years
Social media penetration over the years
Which country has the most active social media users in the world?
Average time spent on social media
Most popular social media platforms
Social media advertising statistics
Frequently asked questions
-
Is there a best time to post on social media?
The best time to post on social media can vary depending on the platform and your target audience.
For Facebook, weekdays from 10 a.m. to 3 p.m. tend to have higher engagement.
On Instagram, posts generally receive more engagement on weekdays around lunchtime and in the evenings.
LinkedIn is most active during working hours, with peak times between 10 a.m. and 11 a.m. on Tuesdays, Wednesdays, and Thursdays. -
How do social media statistics help in advertising?
Statistics give advertisers a comprehensive view of their target audience's behaviour, preferences, and the platforms they frequent.
This enables businesses to make informed decisions, optimise their reach, and improve ROI. -
What makes social media ads effective for businesses?
The power of social media advertising lies in its ability to reach a highly specific audience, thanks to advanced algorithms.
Companies can target potential customers based on various parameters such as age, location, and interests, making each ad more impactful.

Why trust us?

> 150 products tested

3,528 hours of research

6 Smart Home Experts
Smart Home Fox is represented throughout Europe

> 1 million written words

> 5 million satisfied readers per year